Introduction
Machine Maintenance Texts, Downtime Logs, Shift Logs written as texts are hard to analyze. You need to read through them one by one and categorize them manually. See also Howto create pareto charts.
On this page we show you how you can use Excel to automatically analyze your texts and create pareto charts for downtime analysis.
Step 1: Open your excel with the texts
Step 2: On the home tab, select “Add-In”
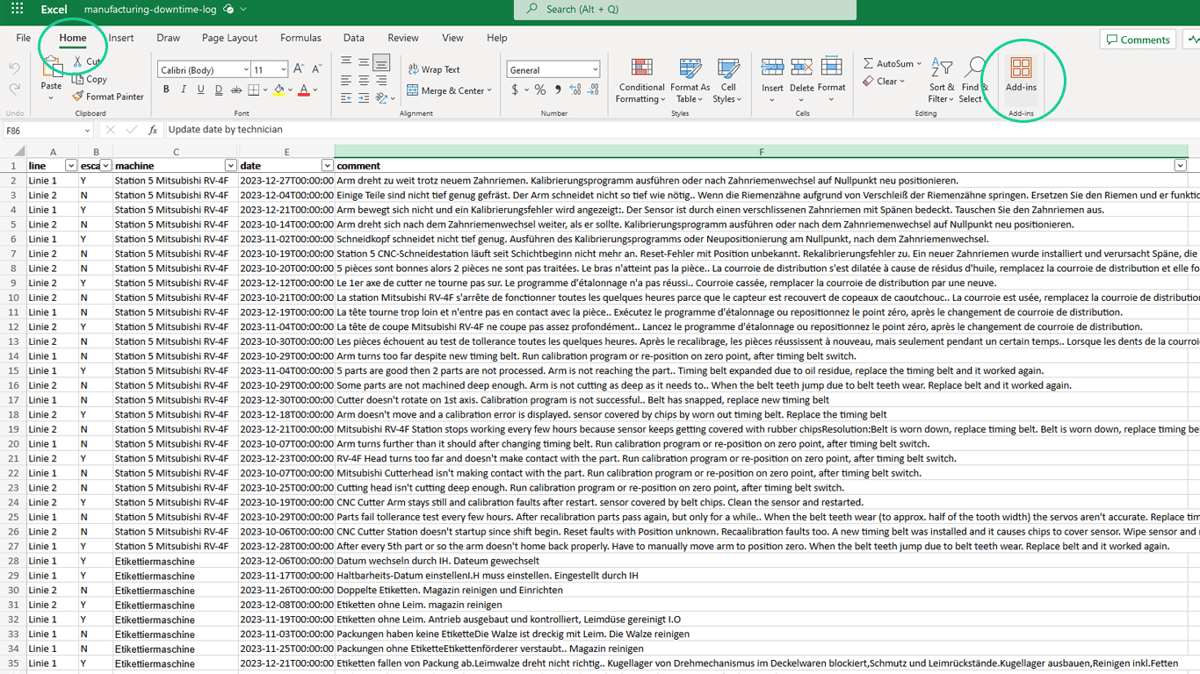
Example of maintenance logs
Step 3: Search for “Peoplegeist” or “Text AI for manufacturing”
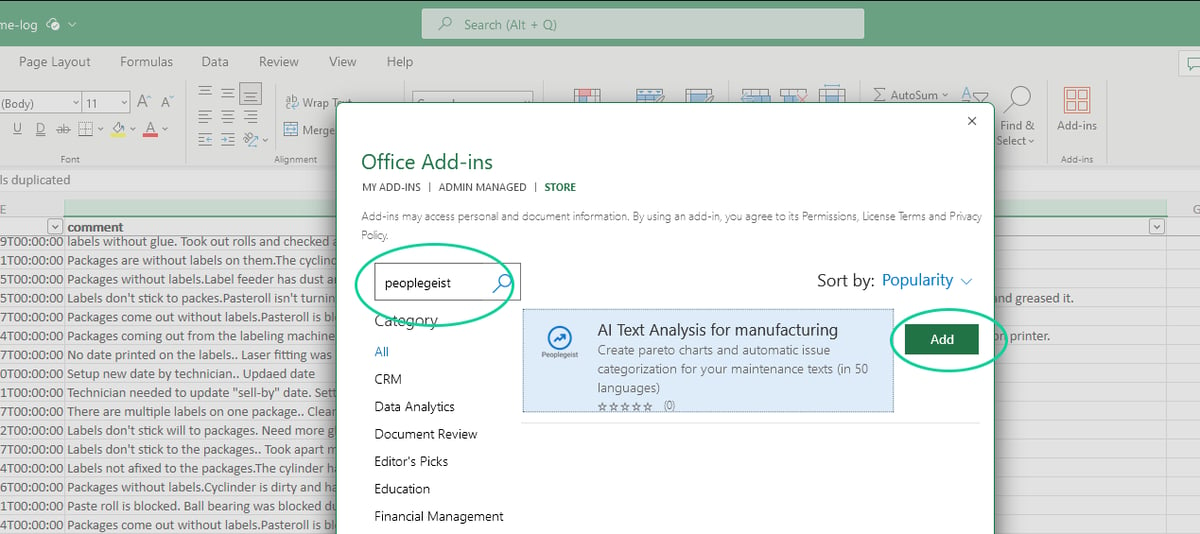
Office add-in store
Step 4: Start the analysis
Review your options and click on "Start the analysis"
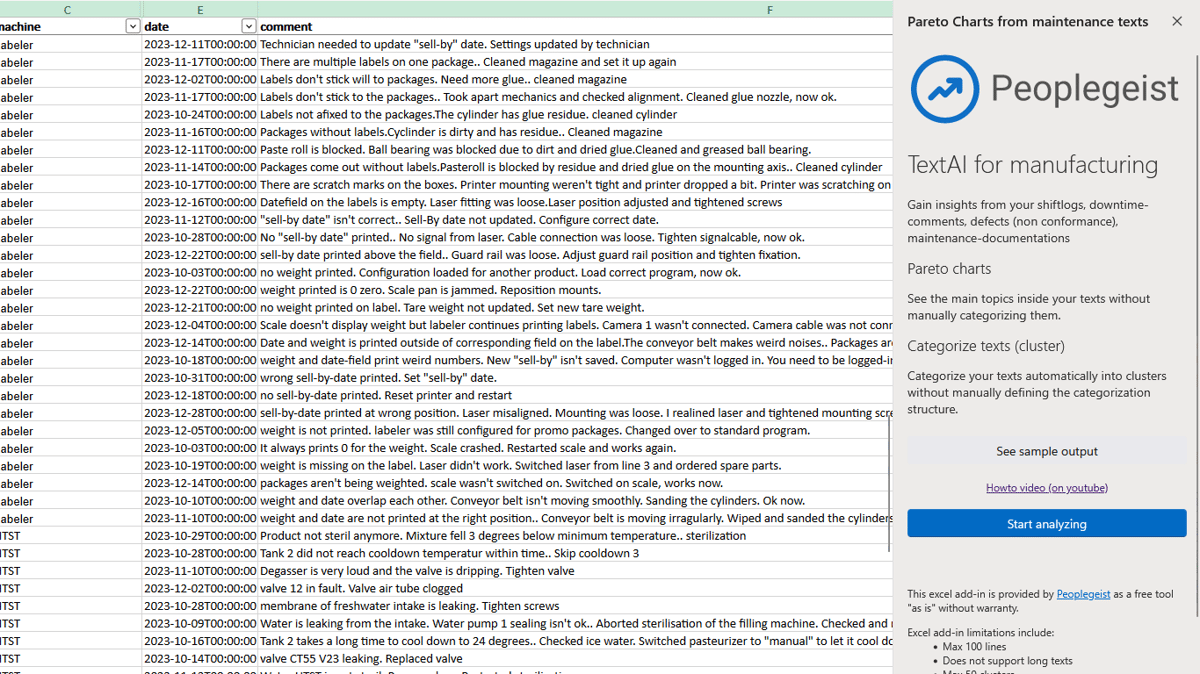
Add-in loaded: Review your options
Step 5: Select the text-cells
- Select the text cells in the excel workshet.
- You will see the selected cells displayed in the add-in.
- You can optionally select the language of the text: Use this option if your texts are very short.
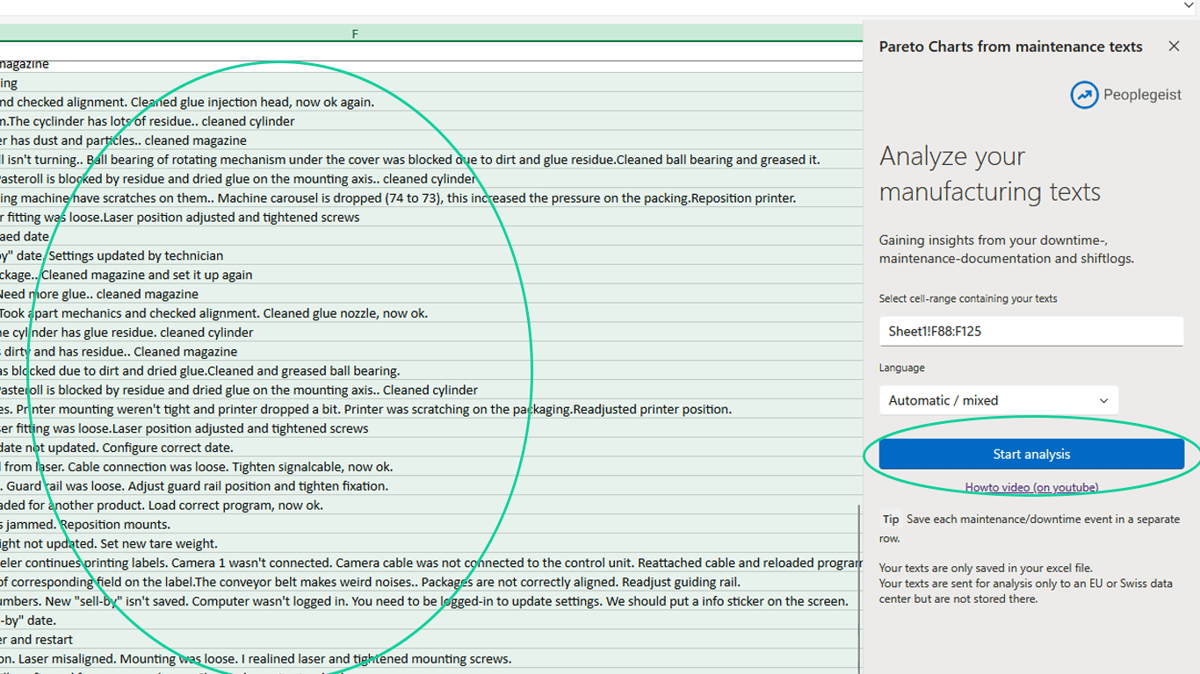
Select your text cells
Step 6: Start the analysis
This can take a few minutes. You can see the progress.
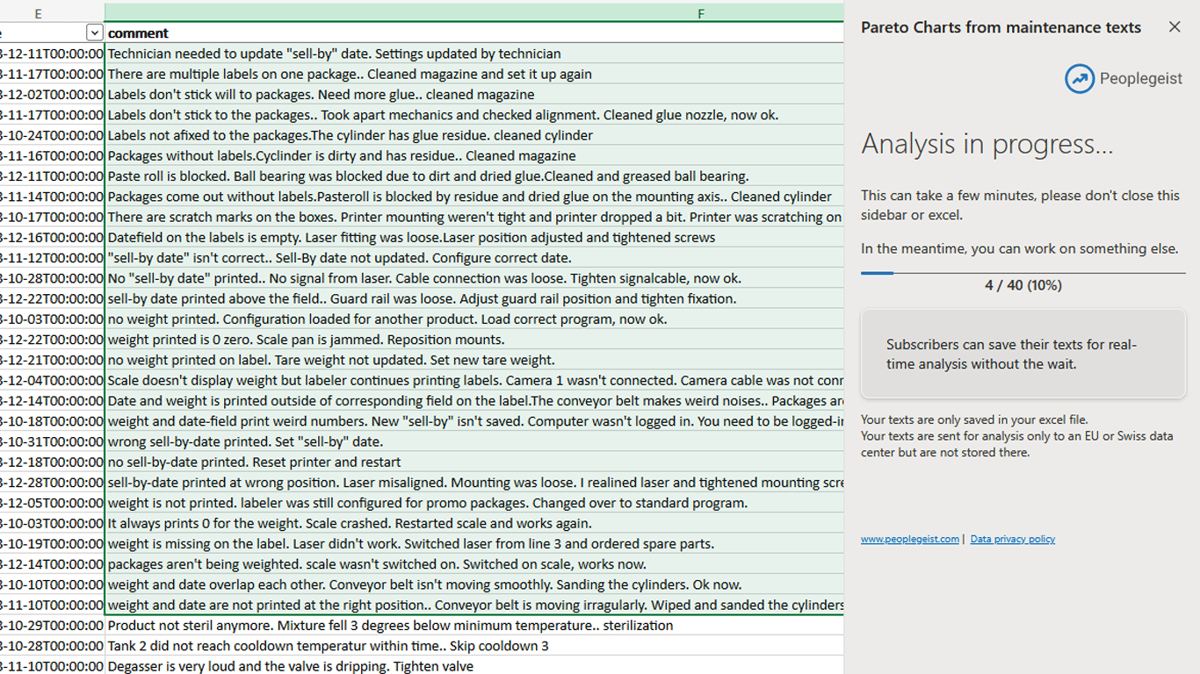
Analysis in progress
Step 7: Preview the results
Adjust the filter to focus on specific aspects inside your texts. You can also use the "detail" slider to fine-tune to get a more fine-grained analysis.
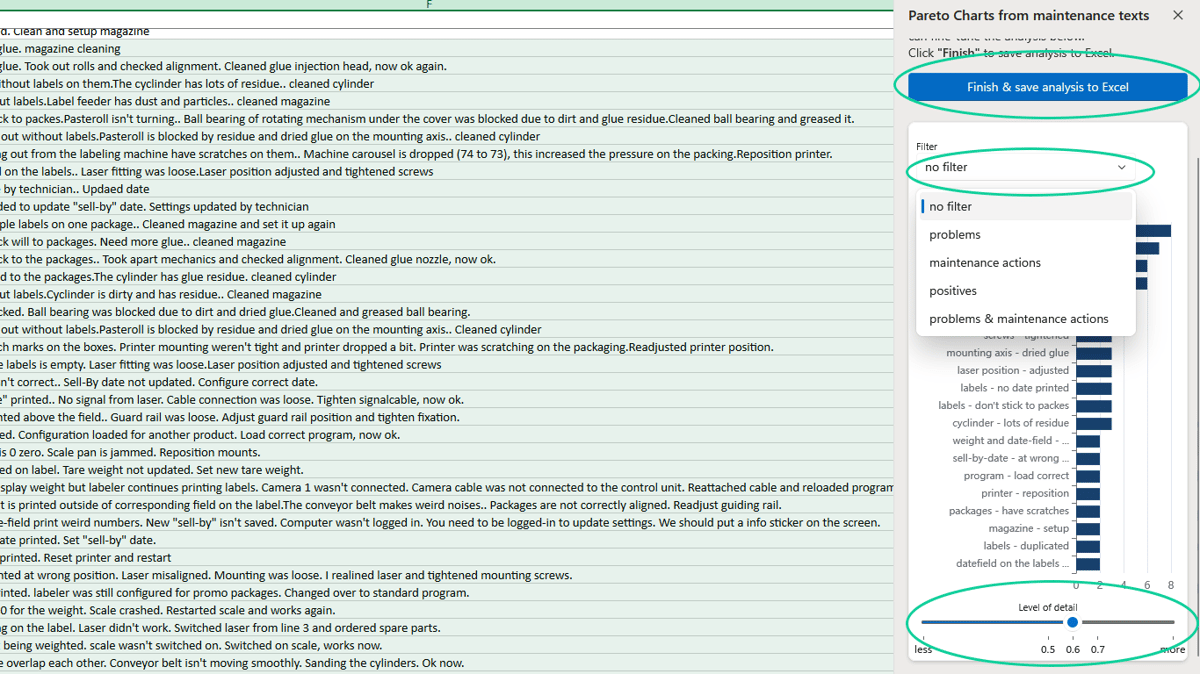
Preview and adjust
Step 8: Finish and save the analysis
You can move the chart away and see all your texts categorized into the various automatically identified categories
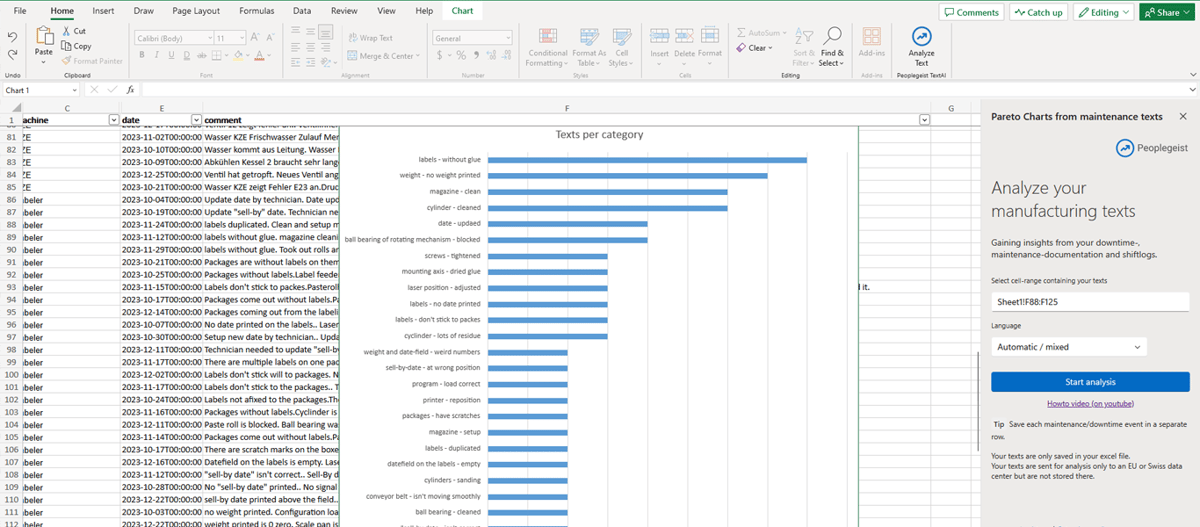
Analysis results in Excel
More links
- See the whole flow also on youtube: How to automatically create Pareto Charts from your Texts with Excel
- Have questions: Contact us
- See the add-in in the office store: Peoplegeist Add-In in Office Store