Introduction
In the article "Create Pareto Charts from maintenance documentation", we explained what a Pareto chart is and how it can be used to effectively visualize the most impactful issues related to the assets within our production or manufacturing system. Now that we have classified data and Pareto charts, what comes next? This article will address how to analyze the information and what can be done with it. It's important to understand that when it comes to analysis and approaches, there are no fixed rules, as procedures and techniques can vary depending on the operational context. However, this won't stop us from working together to build a solution that provides you with ideas for addressing the specific challenges of the production system you are studying.
A thorough Pareto analysis can make a difference in a company's Overall Equipment Efficiency (OEE) by identifying the primary issues that have a significant impact on both unplanned downtime and performance and quality components.
OEE is a metric that encompasses availability, quality, and overall performance within a company.
Where each of the factors are given by the following equations:
As we can see, by identifying the elements that cause the greatest impact on each of the previous factors we can effectively improve the company's OEE.
Analysis of Classified Data
To enhance the availability of our company, we need to start by assessing unscheduled downtime. Improving availability is typically one of the most significant challenges in industrial processes due to the involvement of multiple factors, including safety and environmental concerns. How can we use Pareto charts to conduct accurate analyses that enable us to make effective decisions and mitigate the risks of accidents, environmental damage, or unscheduled plant shutdowns?
Let's look at some analyses:
Data Classification: Downtime vs. Asset
This is the first Pareto chart that we must analyze. It provides a direct answer to our availability problem by identifying the equipment and/or systems that experience the highest amount of unplanned downtime.
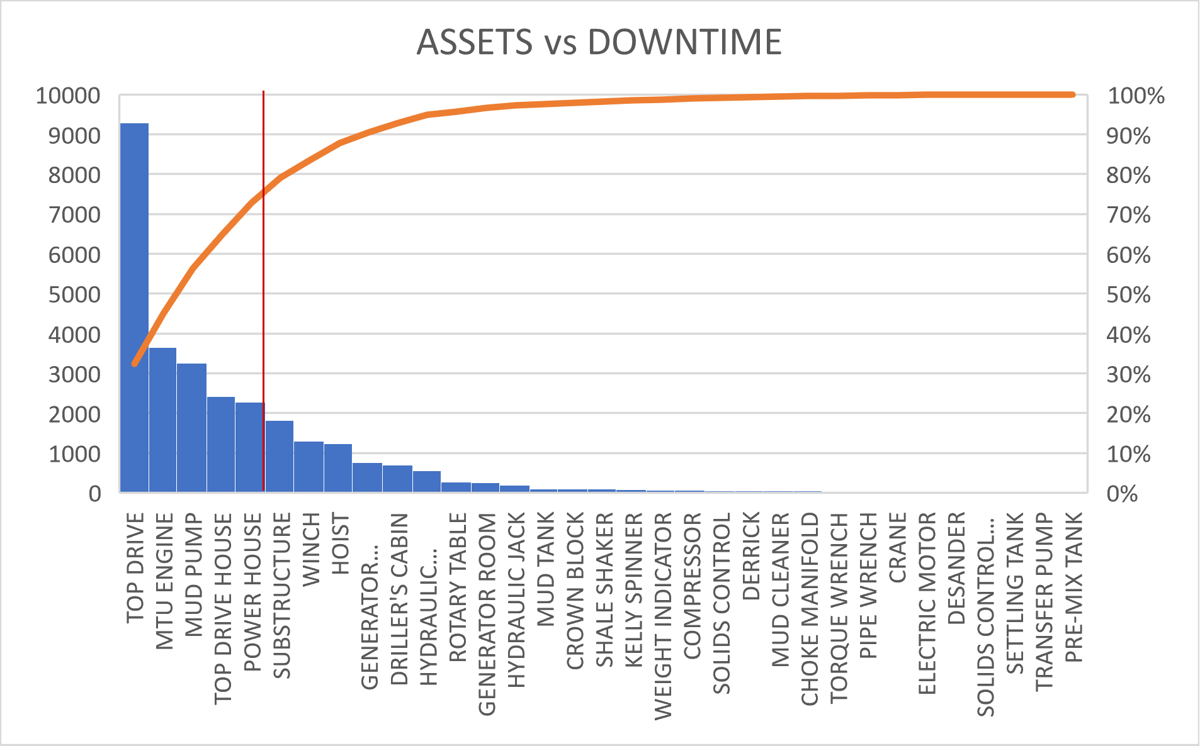
Figure 1: Downtime by Asset
The graph clearly shows the concentration of downtime in the Top Drive equipment and reveals that 80% of the system's studied downtime is concentrated in just six assets.
This data is shocking and indicates that focusing on addressing the equipment that causes the most downtime could increase availability by more than 30%.
Data Classification: Failures vs. Assets
This analysis addresses a crucial question in production systems: which equipment and/or systems experience the highest rate of failure, or in other words, where are the most concentrated failures within the production system we are studying?
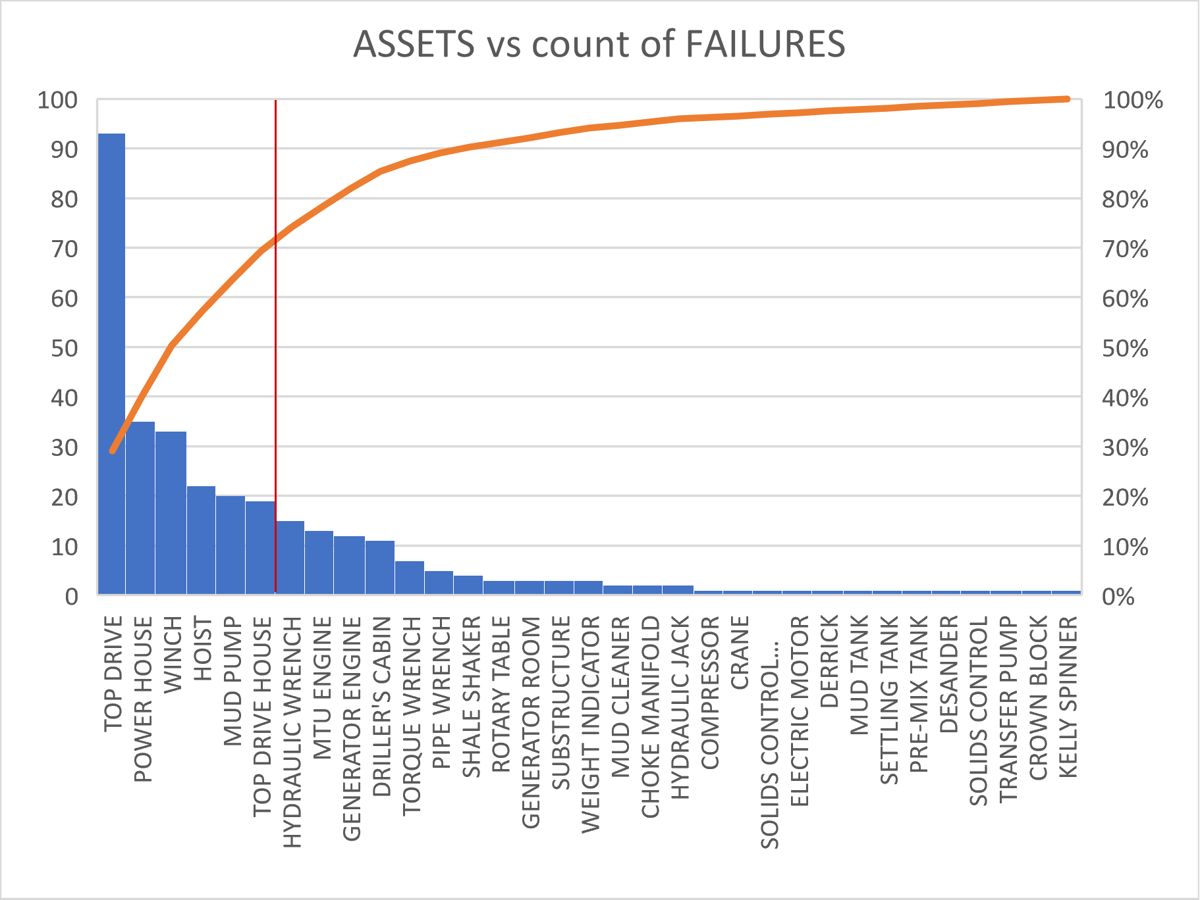
Figure 2: Failures by Asset
In the previous example, it is evident that any activity must begin with the TopDrive equipment. This equipment alone accounts for approximately 30% of all failures. Then, by examining the graph that illustrates the cumulative percentage of failures, it becomes evident that 80% of the failures are concentrated in just 8 assets. Therefore, implementing a comprehensive failure response plan specifically for these equipments will have a substantial impact on overall availability. The efficiency of the system and, consequently, the Overall Equipment Effectiveness (OEE) of our production system.
It is possible to characterize our failures not only by asset, but also by system or some other characteristic. For example, in an oil drilling rig, there are five main systems. Following the study's example, they have the following concentration of failures.
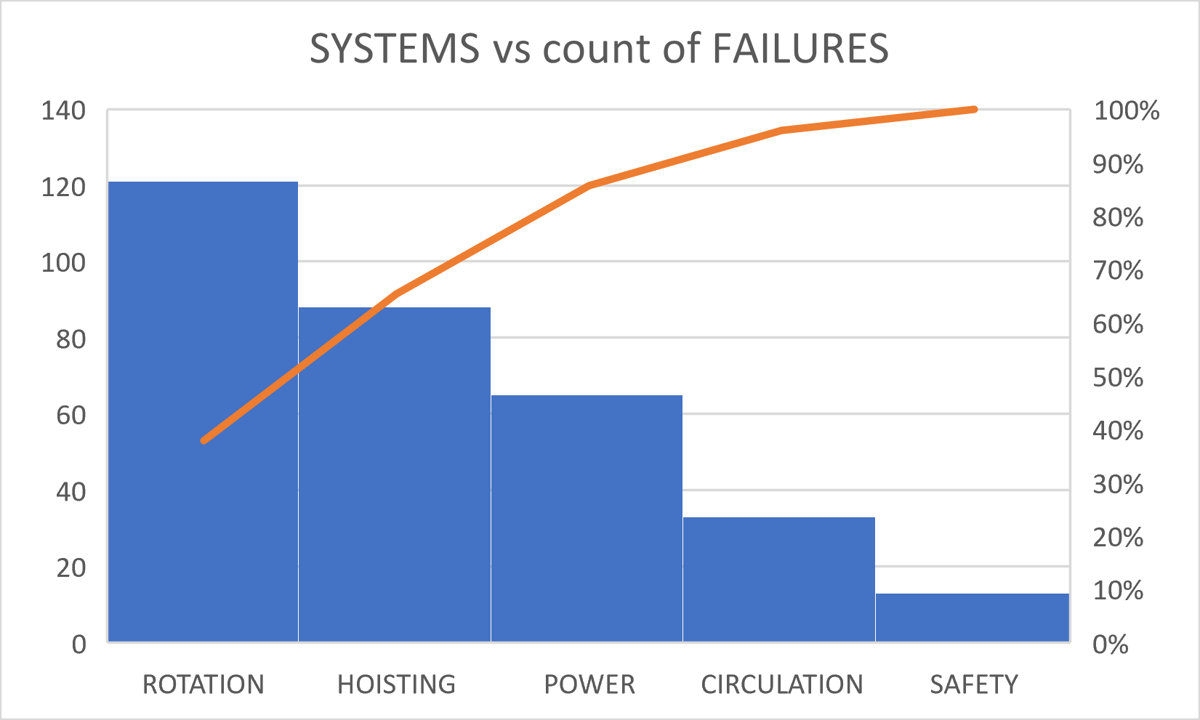
Figure 3: Failure by Systems
It is interesting to note that some of these characteristics may not be specifically mentioned in the table filled out by the worker, but are included in the final comments describing the failure and how it was resolved. This feedback, combined with the utilization of TextAI-based tools, can categorize various levels of these errors, enabling us to gather more comprehensive and specific characteristics to enhance our analysis.
It can be seen that the rotation system is where the highest number of failures is concentrated. When reviewing the teams in the rotation system that contribute to the total number of failures, and using a Pareto diagram, we obtain the following graph:
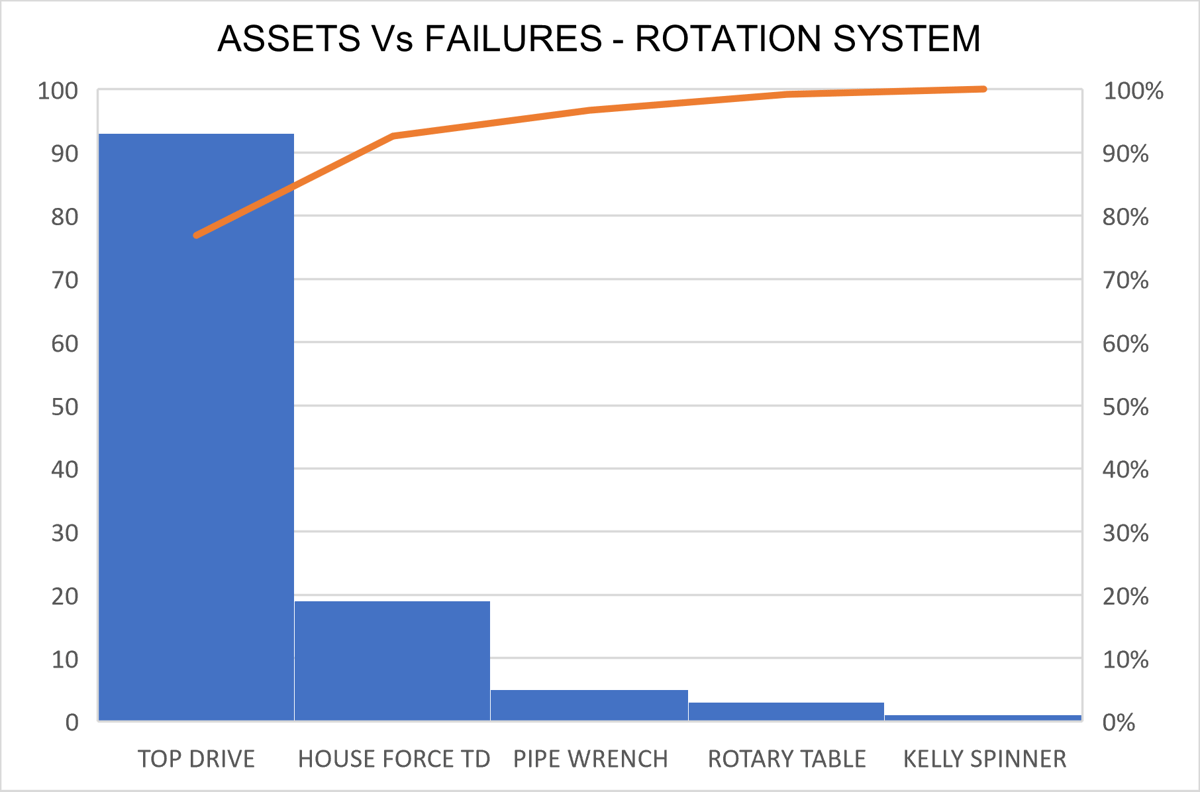
Figure 4: Failure by Asset – Rotation System
Where TopDrive equipment alone accounts for almost 80% of the total number of failures.
We can observe that even when employing two distinct methods of analysis, we arrive at the same conclusion. This convergence does not diminish the credibility of either approach; rather, it enhances the comprehensiveness of our study.
Combining Classified Information for In-Depth Analysis
In addition to the previous graphs that represent the number of failures and downtime as initial observations, we can analyze patterns, trends, and relationships between the different factors that impact our operations. By doing so, we can enhance our decision-making process. We refer to these analyses as multifactor analyses, and Pareto charts are an important tool that help us make successful decisions.
We are going to provide some examples that will help us better visualize the previous concept. The information completed by the worker responsible for addressing the failure includes various fields, such as equipment, system, type of failure (mechanical, electrical, pneumatic, software, human, power, etc.), downtime, and observations. These fields always depend on the operational context, and there can never be too many of them. We must not forget that the primary task of the person repairing the fault is to fix it. Complex tables often lead to incorrect data entry, which can become a significant problem. Now, each failure generates a service order that triggers additional fields and tables in various departments of the company. An example of this is the materials used during the repair process and the associated costs that contribute to the "Cost of Repair" key performance indicator (KPI).
There is another key performance indicator (KPI) called "Lost Production" that measures the amount of downtime in relation to the products that were not produced. This indicator is impactful because it allows decision makers to visualize the equipment failures and downtime that are causing the most production losses, which directly translates to financial losses. This applies, for example, when you have two identical production lines that produce different products, and one of them has a significantly higher market value than the other. In this case, a failure in the production line results in the same amount of downtime and repair cost, but it leads to a significantly higher economic loss due to the lost production. In the example of the drills that we worked on in the previous chapter, it could refer to an oil field that produces significantly more oil than another. Therefore, a failure in one of the drills will result in a significant decrease in production. Another example could be a pharmaceutical company that operates two identical production lines. However, one line is dedicated to producing vitamins, while the other focuses on manufacturing a medicine with significant social and economic impact, such as insulin.
A Pareto diagram, which identifies the most significant impacts on various factors, provides us with a more precise understanding and thorough analysis of the reality of our production system. Consequently, we can develop more effective action plans that will have a greater impact on the Overall Equipment Effectiveness of the company.
Incorporating safety and environmental data into the analysis
Although we have a clear idea of where to start with the previous data visible in the Pareto diagram, we must also study the operational context in which our production system operates. This is because our graphs only include assets or systems that have experienced some form of failure. However, there may be critical equipment that, although it did not having failed at the time of the study, could have very serious consequences for the physical integrity of the workers, the environment, or the global economy of the company. This is why it is necessary to identify what these critical assets are and, if they exist, to determine appropriate action plans for them.
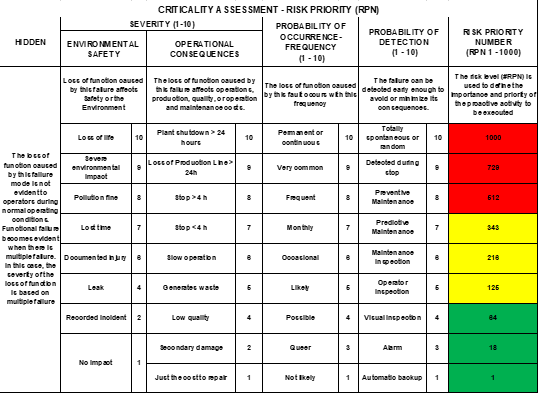
Figure 5: Failure by Asset – Rotation System
In the previous graph, there is a table that allows for assigning a criticality number to the assets, known as the Risk Priority Number (RPN). It is important to include all system assets in this process, even if they have not failed for a long time and do not appear in our analysis conducted using Pareto diagrams. This ensures that we do not overlook assets that may pose the highest risks. In this article, we will not delve into the use of criticality analysis. However, we cannot conclude without acknowledging this aspect.
Reliability and Availability Techniques
There are industrial reliability techniques where the use of Pareto diagrams and their respective analyses is a fundamental part of their execution. Below are some of these techniques with a brief description:
a. Failure Mode and Effects Analysis (FMEA): This technique allows you to evaluate the risk and quality of products and processes using a single tool. This method aims to identify and describe potential failures in the process or product before they occur or are delivered to the client. It works for both discrete and continuous production processes and enables you to identify the ways in which the system can fail and their corresponding effects, as well as the impact on the safety of people and the environment. The comments included in service orders, both by operators and maintainers, that describe operating problems and that are analyzed by TextAI, ensure that no modes or effects are overlooked in the analysis. With this improvement, the analysis becomes more effective.
b. Reliability Centered Maintenance (RCM): is a maintenance planning concept based on system reliability. The aim of this is to ensure that systems continue to function as required by the user in their current operating context. Successful implementation of RCM will lead to an increase in profitability, reliability, and availability. It will also provide a better understanding of the level of risk the organization is exposed to and the actions that can be taken to mitigate it. When information about failures, processes and feedback is included in an information system as comments, TextAI tools can help us determine which equipment is outside of maintenance plans, alert us to the timing or frequency of maintenance activities for equipment that falls outside acceptable parameters. Additionally, these tools can guide us in determining the optimal downtime for carrying out planned maintenance and identify the spare parts that may be needed to ensure its success.
c. Fault Tree Analysis (FTA): is a deductive top-down method of failure analysis in which an undesired state of a system is analyzed using boolean logic to determine a series of low-level events. This analysis method is mainly used in the fields of safety engineering and reliability engineering to understand how systems can fail, identify the most effective ways to reduce risk, and determine or obtain an initial understanding of event rates within a system. This method is included in both FMEA and RCM techniques, as both require understanding the main function of the system and, from this, descending to more detailed levels to identify how failure events can occur. Failure modes and effects can be included in comments from operators or maintainers indicating situations such as mixer failure due to motor overheating caused by an excess of material in the line. This comment could indicate that the mixer lost its mixing function due to a motor failure caused by an excess of material. The documentation analyzed by TextAI can allow us to perform more accurate analysis and take more effective actions in the development of maintenance plans.
d. Root Cause Analysis (RCA): It is a structured process designed to identify the underlying causes of a problem. This approach involves collecting and analyzing relevant data to understand why a problem occurred in the first place. The goal is to address the root causes in order to prevent the problem from happening again. RCA, instead of focusing on surface effects, seeks to identify the fundamental causes of process or system failures, making it a valuable tool for problem-solving and continuous improvement. The first step in root cause analysis, before following the 5 whys, is to analyze the problem and its causes. For example, let's say the washing machine is making noise, and this could be due to Reason A or Reason B. The maintenance action is to check and tighten the screws. Therefore, this means that a loose screw is a possible reason. Software such as TextAI can greatly assist in analyzing internal causes of other systems and/or failure modes, similar to the one described in the previous example. It can guide us in conducting the analysis of the "5 whys" and help us be more effective in finding the true root cause of the problem and determining appropriate mitigation strategies.
The previous techniques are implemented with a multidisciplinary team in order to incorporate diverse ideas, experiences, and perspectives, and to improve their effectiveness in practice.
Conclusions
In this article, we have seen what to do after generating Pareto diagrams and how they can effectively address recurring problems that have the greatest impact on various production and manufacturing systems. We learned how to conduct an in-depth analysis using Pareto diagrams. This analysis goes beyond simply considering the number of failures and downtime. Instead, we also consider factors such as repair costs and production losses caused by stoppages. By analyzing these different aspects, we are able to make more impactful decisions from multiple perspectives on the company's Overall Equipment Effectiveness (OEE).
We understand that studying only the equipment included in the Pareto diagram is not sufficient. We must also conduct a criticality study of all our assets to identify those that may have significant safety consequences for people, impact on the environment, or have a significant impact on the company's economy. All of this depends on the operational context in which the production process operates.
The use of Pareto diagrams with various indicators is a powerful tool for directing our efforts and resources towards the assets or processes that have the greatest impact. When combined with industrial reliability techniques, these diagrams enable continuous improvement, reduce failures, and mitigate risks. This, in turn, enhances production and promotes sustainability in the production process.
Tools based on TextAI can be integrated into solutions applicable to any stage of the process. They have the ability to learn from failures and provide guidance in the development of analyses and plans to mitigate issues in the production process.