Introduction
In any production process, one of our primary concerns is how to increase our production efficiency. In other articles, we have used the Pareto diagram as a visual tool to identify main problems. In this article, we will seek to address, in a practical way, how we can improve production in a manufacturing production line.
In this line of thought, we will address some questions to initiate our analysis.
Is Increasing Production the Same as Reducing Downtime?
Increasing production and reducing downtime are two extremely important variables that must be addressed differently but are not the same. Production can be increased in other ways. For example, by improving cycle time or reduce ejected pieces while maintaining the same downtime.
If I maintain the same initial characteristics of the system and reduce downtime, I will achieve higher production by the end of the analysis period. Therefore, reducing downtime will always be a very important goal for all plant management.
Is Increasing Production Equivalent to Improving OEE (Overall Equipment Effectiveness)?
Keep in mind that the OEE is a calculation that takes into account three variables: availability, performance, and product quality. If I can increase any of the parameters without decreasing any others, I can enhance the Overall Equipment Efficiency (OEE) of our system.
In general terms, production can be increased by improving downtime (enhancing availability), improving plant performance, and/or reducing the number of products rejected in the quality control process. Generally speaking, increasing production can improve our OEE as long as it does not have a negative impact on any of its variables.
Visualize the Current State
One of the most valuable insights into maximizing production is to gain a comprehensive understanding of the current state of your production line. When evaluating the current situation, it is essential to consider key aspects such as the availability of assets and the efficiency of the production line.
List all machines and production steps as a chart and annotate at each step:
- Total availability of machine (in hours)
- Actual operating time of machine
- Speed (how many parts can be processed per operating hour)
- Capacity per day (actual operating time * pieces/hour)
- Defects/rejections per hour
- Net Throughput (Throughput – Defects/per hour = Good parts per hour)
We have a simplified example production with 4 steps. It could be in food production.
- Chocolate production
- Chocolate bar forming
- Foil wrapping
- Boxing and palletizing
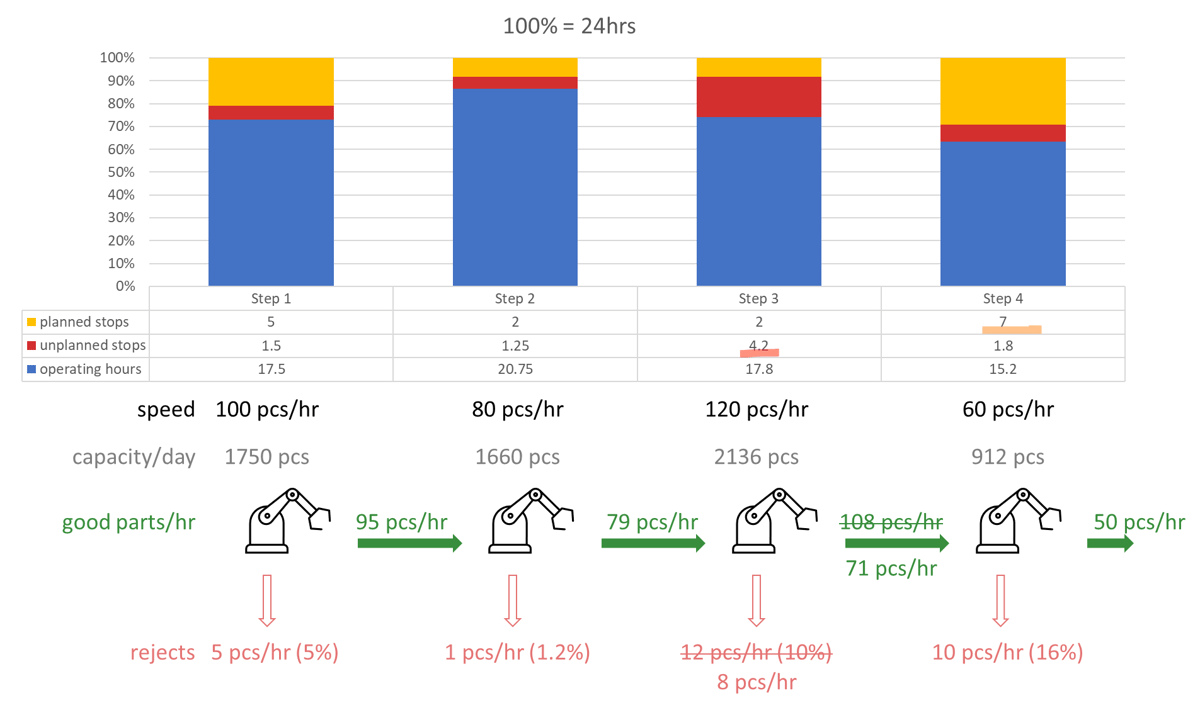
Figure 1: Figure 1: Visualize your line example
What do we see here: We start with 100pcs/hr and somehow at the end we only get 50pcs/hr
After visualizing your production flow it’s easier to understand what happens and it’s easy to see how the machines are interdependent.
Instinctively, one would collect rejection and downtime reasons and create pareto charts from it. However, this practice can cause us to overlook important aspects such as the workflow or production, as well as safety and environmental factors.
Find your bottleneck
When it comes to increasing production, the key isn't always identifying and resolving the longest downtime. As we have seen in the previous example, sometimes, the key to achieving greater efficiency lies in identifying and addressing bottlenecks in your production line. The bottleneck is the work area with the lowest performance (fewest good-parts/hour). This approach allows us to move from bottleneck to bottleneck, iteratively improving the efficiency of the entire production line.
The first step in this strategy is to identify the station or work area on your production line with the lowest flow-rate. You can think of it as the weakest link in the chain. If you strengthen this link, you will improve the overall efficiency of the line. This means that you shouldn't always address longer downtimes, as they may not be the most limiting factor in your process.
In our example we can see that Step 4 can only handle 60pcs/hour but step 3 delivers 71/pcs/hour.
We also see this in the capacity/day. Step 4 can only handle 912pcs while the previous step could deliver 2136pcs.
You can improve Step 4 in three ways:
- Lower planned stops: Increases operating hours, thus total capacity
- Increase speed: Increasing pcs/hr increases capacity
- Lower unplanned stops: Increases operating hours, thus total capacity
Not strictly related to input bottleneck but to overall output, you can also try to reduce the rejection rate. This would result in more good parts at the end of the day.
Improve from the end of the line
In our example we see that the flow-rate between all production steps don’t line up. One approach is to start improving your production line from the end. If we identify a bottleneck at the end of the production line, such as our packaging capacity, it does not matter how much we optimize our process at the beginning of the line because our overall production will be limited by the final bottleneck. In this way, by increasing the packaging capacity of the line, we will be able to increase our production and identify any potential bottlenecks, ultimately achieving maximum overall efficiency of the production system.
Increase availability
Long planned downtime
In our example want to start improving Step 4.
Downtime is 1.8hrs/day and we could create a pareto chart of our downtime documentation with TextAi for example.
The bigger opportunity is however to also look at the planned downtime. The bigger loss at Step 4 is 7hr of planned downtime per day.
You can look at your maintenance documentation and see why you are spending so much time on this machine.
Is it due to issues with the setup taking longer than expected? Are there any difficulties when reconfiguring a production line? The strategic solution must target the main causes, train personnel and carry out maintenance procedures that allow tasks to be carried out more efficiently and within the scheduled shutdown times.
Line changeovers
Line changes can be a critical point in production. It is normal for these changes to cause some problems after the reconfiguration has been performed. To effectively address this situation, it is recommended to improve the checklists utilized during line changes. To achieve this, it is important to involve machine operators in the process of improving the verification checklists. Conducting interviews with operators and cross-referencing the information obtained with data and comments provided by maintainers during equipment maintenance tasks can generate a valuable source of knowledge. This information, when combined with TextAI tools, can enhance the identification and resolution of common problems that occur after line reconfiguration. Ultimately, this contributes to a smoother and more efficient transition between different products or processes.
Increase operating time
Unplanned cleaning
Cleaning activities should be treated like any other maintenance activity. Making unplanned stops to clean the line increases non-productive time and distances us from our production goals. This is why we can perform superficial cleanings that do not require stopping production, such as daily operational tasks, as well as deep cleanings during scheduled production line stops.
We can schedule cleanings during line change or weekly cleanings. This reduces the chance of unplanned stops.
Decrease MTTR
By reducing the Mean Time To Repair, we can minimize unplanned downtime, which results in greater effective production time. That is why having repair procedures carried out in a clear and effective way, taking advantage of the experience of previous repairs conducted by company workers on the same or similar machines, not only speeds up the repair process, but also ensures that we have the necessary spare parts to achieve the repair more quickly and effectively.
CIP / SIP: Cleaning in Place / Sterilization in Place
Cleaning and Sterilization in Place (CIP/SIP) process is an important but also often time consuming process. It can take hours to do a full sterilization run. Isolate all unplanned CIP/SIP runs and identify the causes for those extra runs. Reducing these sterilization runs can save you hours of machine downtime and operator time.
Training Gaps
Among workers, it is common to have gaps in training and knowledge that must be addressed effectively in order to minimize them and prevent them from posing a risk to both safety and the operational continuity of the production line, which could result in errors during the closure of these gaps.
With TextAi you can see what kind of problems happen very often. With a root cause analysis you can identify those problems which are perhaps not performed well. Here are potential training gaps.
Maintenance calls for problems, that should be handled by an operator is also an indication of a training gap.
Find out the problem reasons for maintenance calls and identify those reasons that should have been covered by the operator.
TextAI tools can also help us reduce these gaps by utilizing the information documented in the service orders of operators and maintainers and making it accessible to less trained personnel, guiding them in performing their tasks and help them understand the problems that have already occurred and how these issues have been resolved.
Reduce “Maintenance Calls”
Maintenance teams are often very busy and waiting for maintenance crew to arrive is lost time on the production and additional workload on the maintainers. If you do a breakdown for all the maintenance-call reasons, you can sometimes find tasks that are not too complex and can be taught to the operators. Tasks that happen a lot, ie. part of line changeover and software parameters are good candidates to teach operators.
Standard trouble shooting guides can also help. For example teach the team to try frequent trouble shooting steps before calling for help, might reduce many calls.
Safety and staff health
It is also essential to assess the possibility of potential failures that are dangerous to safety of staff and the environment. For example there is vibration from one machine that causes other machines to fall out of sync and more importantly make employees feel squeezy. For this reason, it is essential to have a criticality map of our equipment and processes and ensure that these potential failures are included in the analysis.